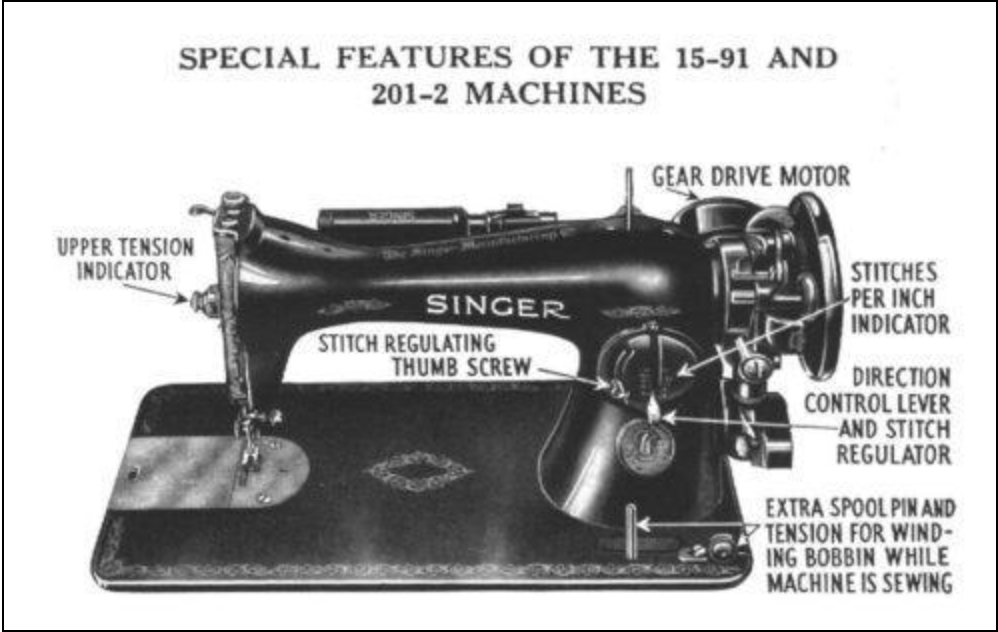
Last November I realized my 15-91 was overdue for servicing (maintenance, internal cleaning, oiling and minor adjustments). Since I have not yet gained the confidence to do my own maintenance and internal cleaning (beyond cleaning out the bobbin area), I figured I should take it into a store.
My father-in-law had it serviced before giving me the machine so this was the first time I was arranging to do this myself. I found a store that was able to service the machine, and the night before I was planning to drop it off I decided I should gather everything I would need (bobbin, bobbin case, screw tool) and remove the machine from my cabinet. Something that should be straight forward, right?
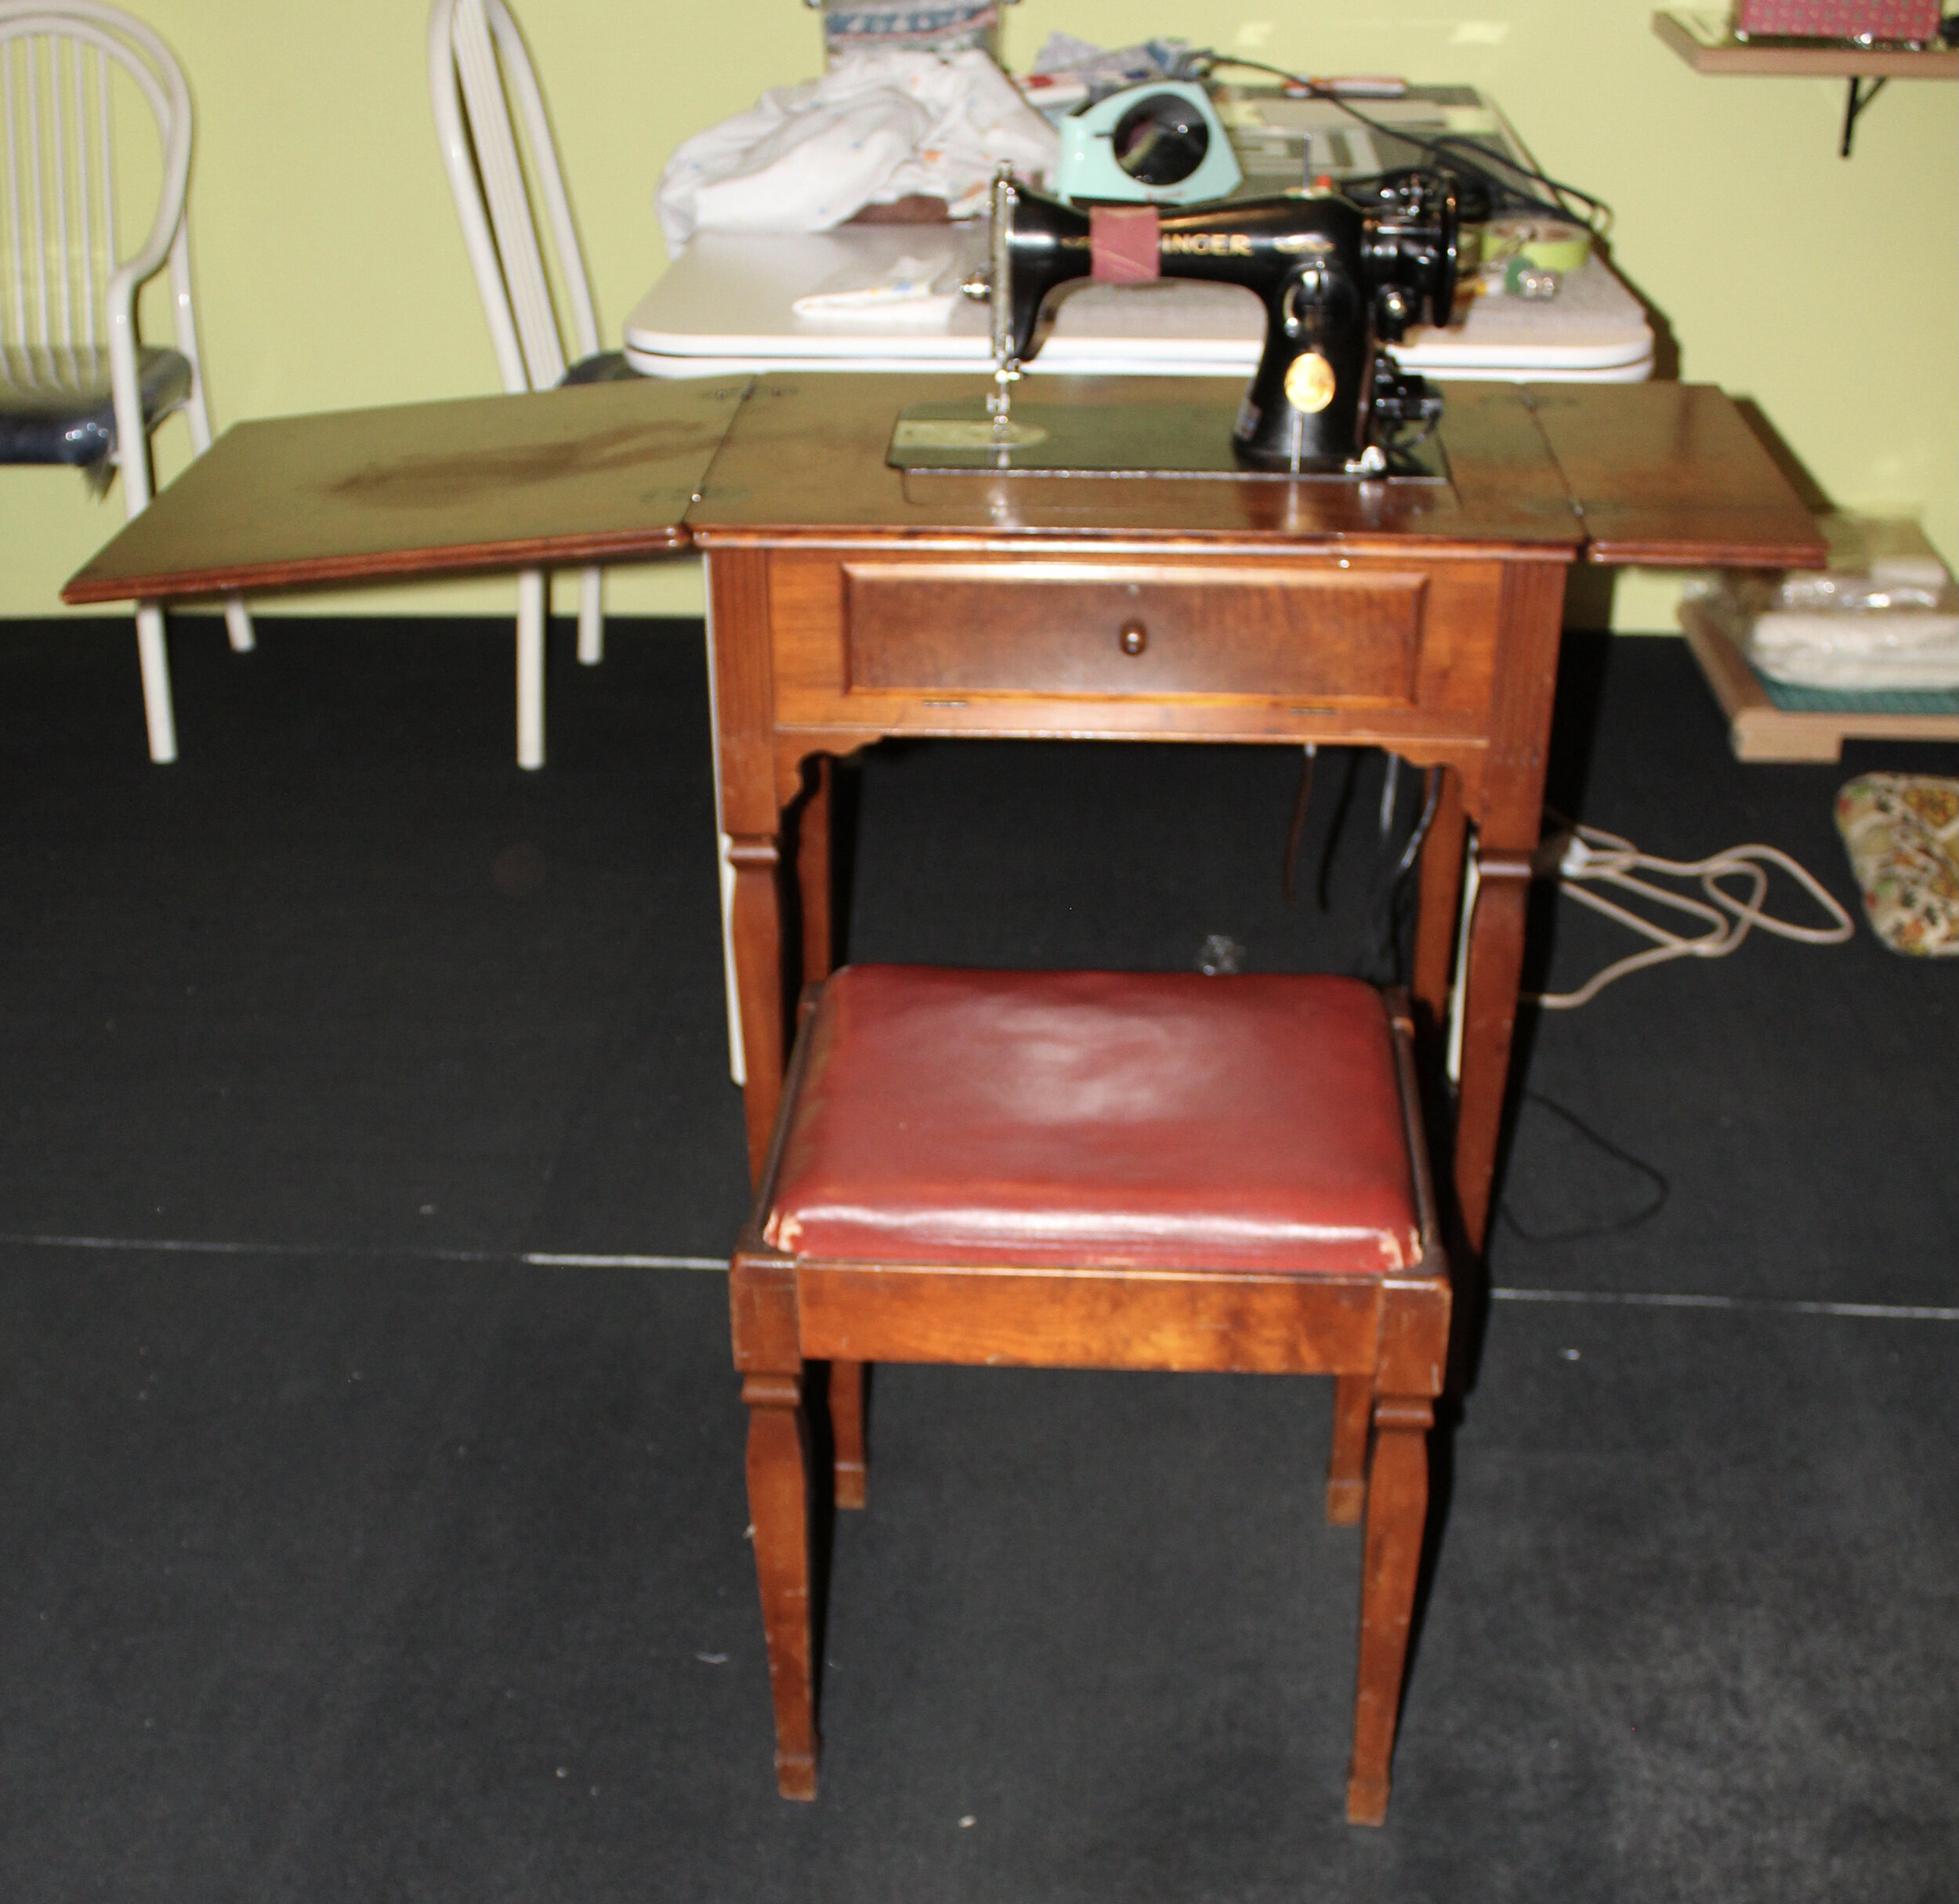
Steps for removing the 15-91 from the cabinet (#40)
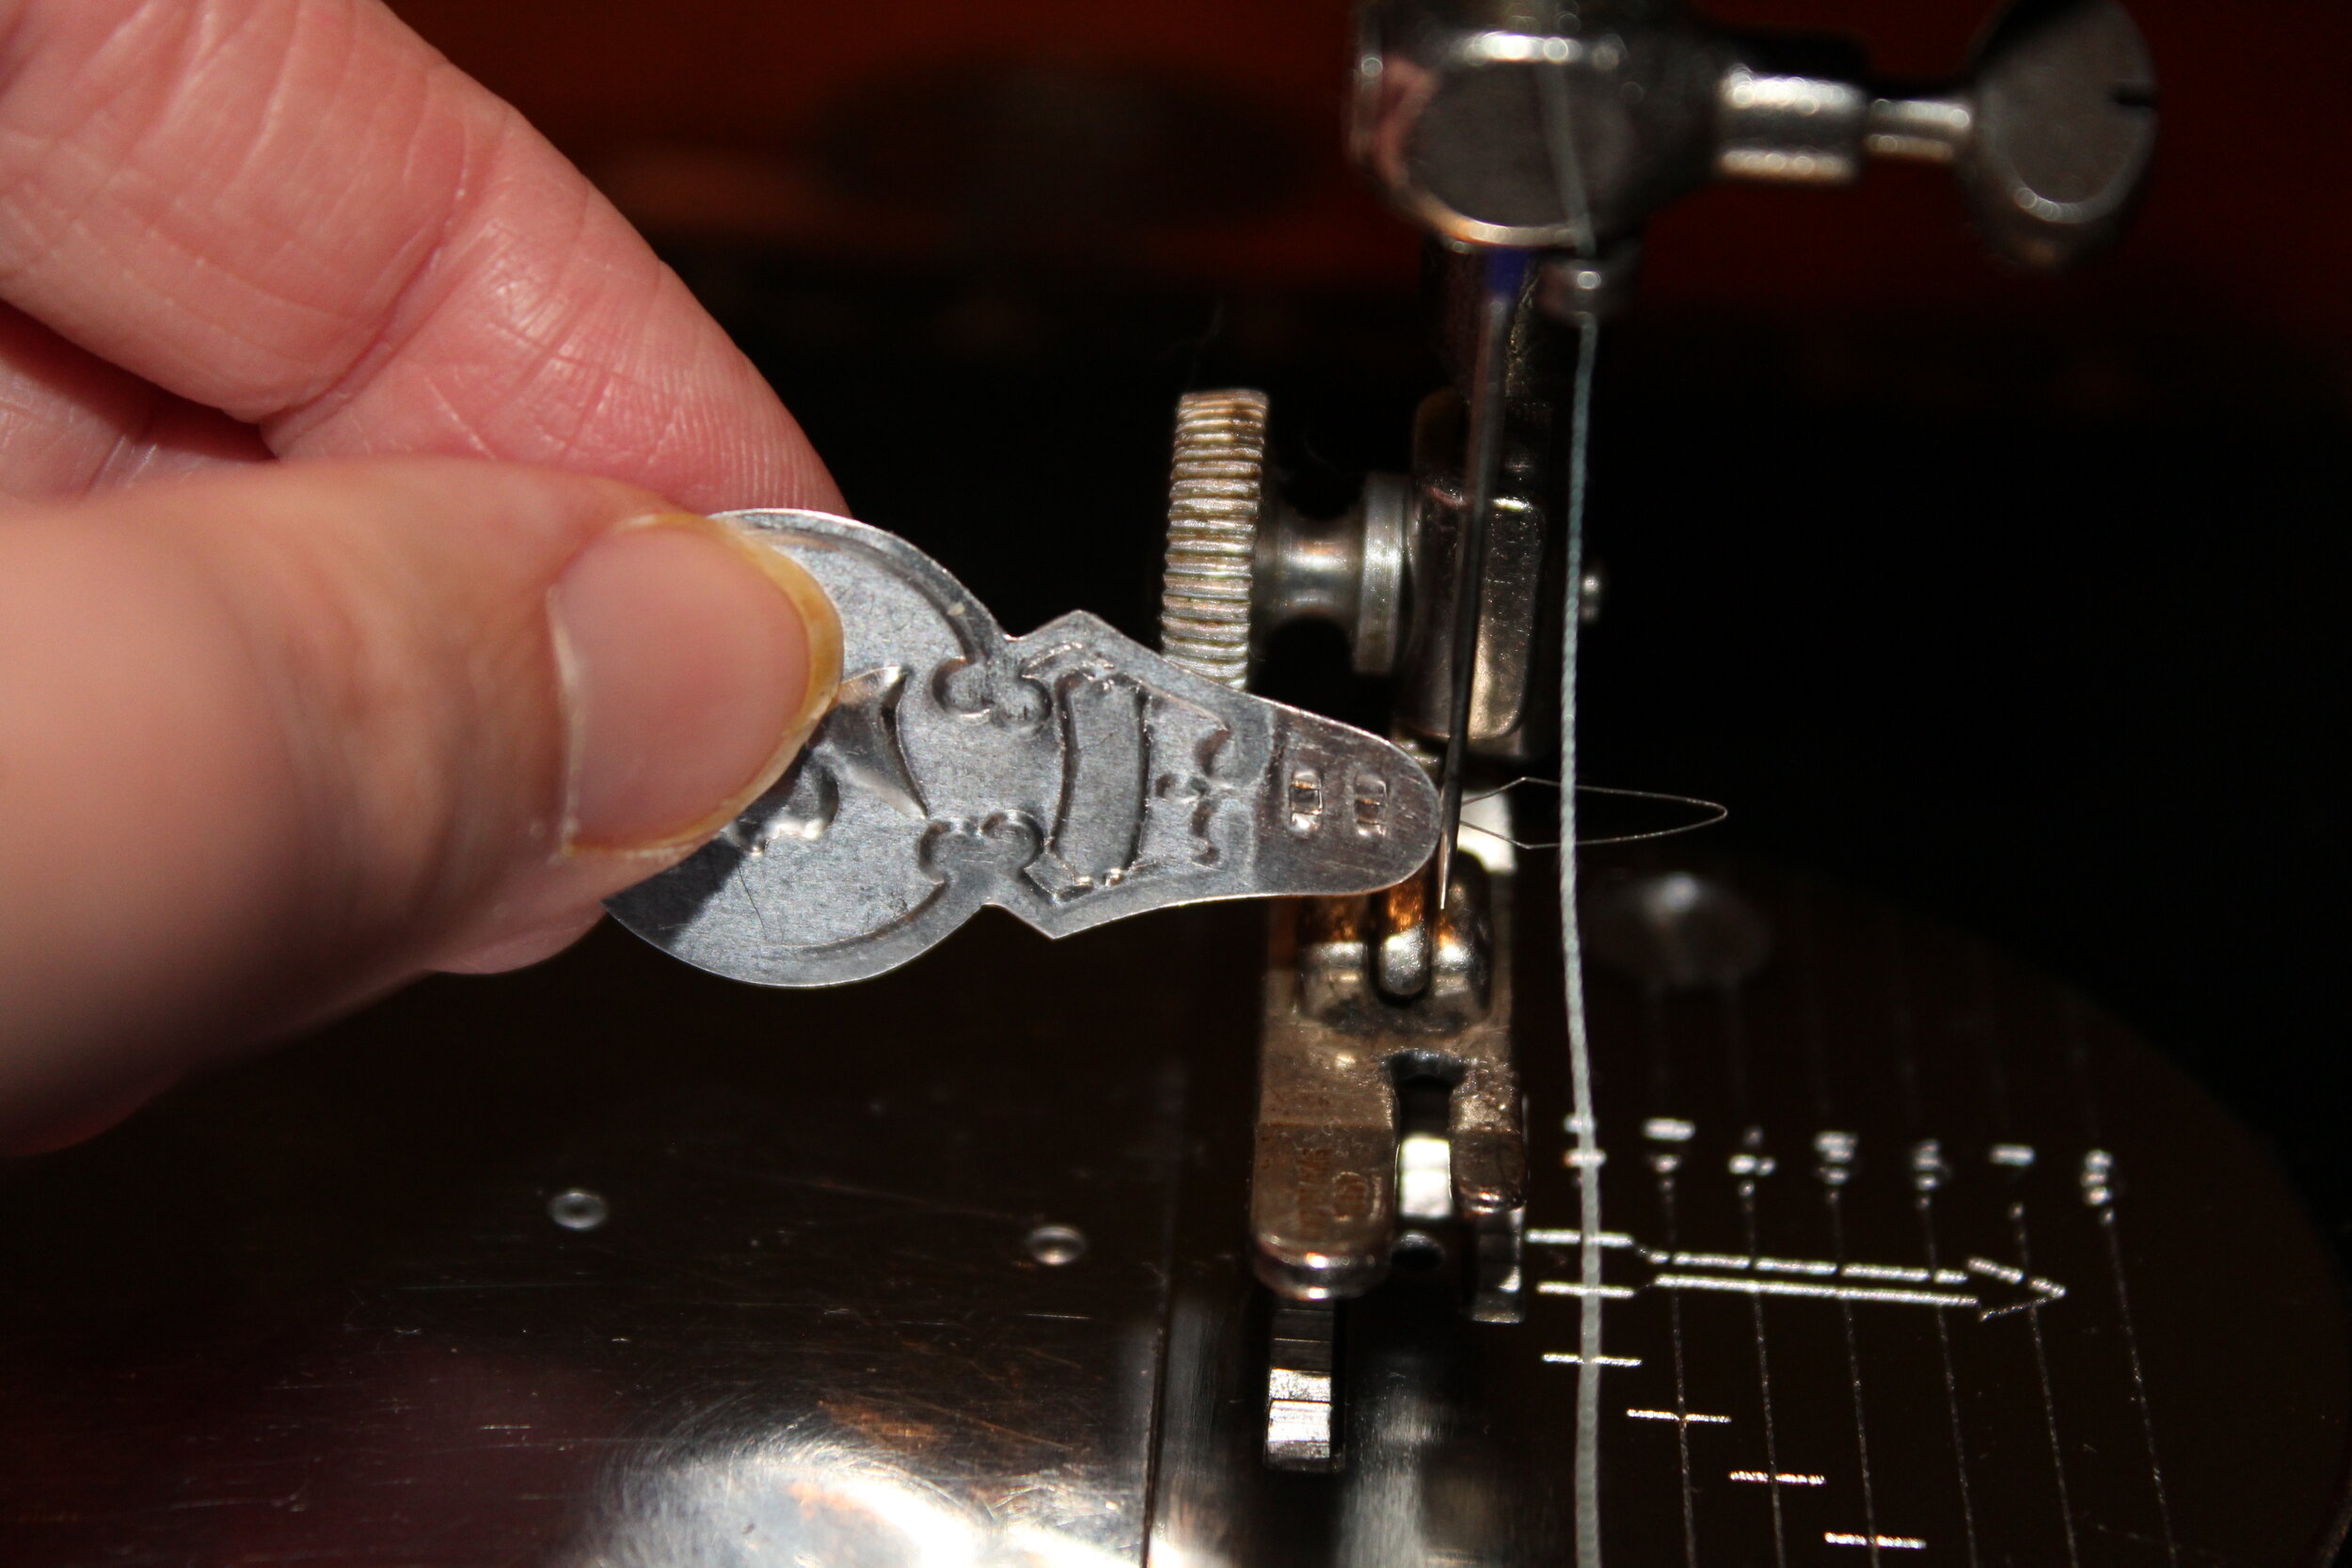
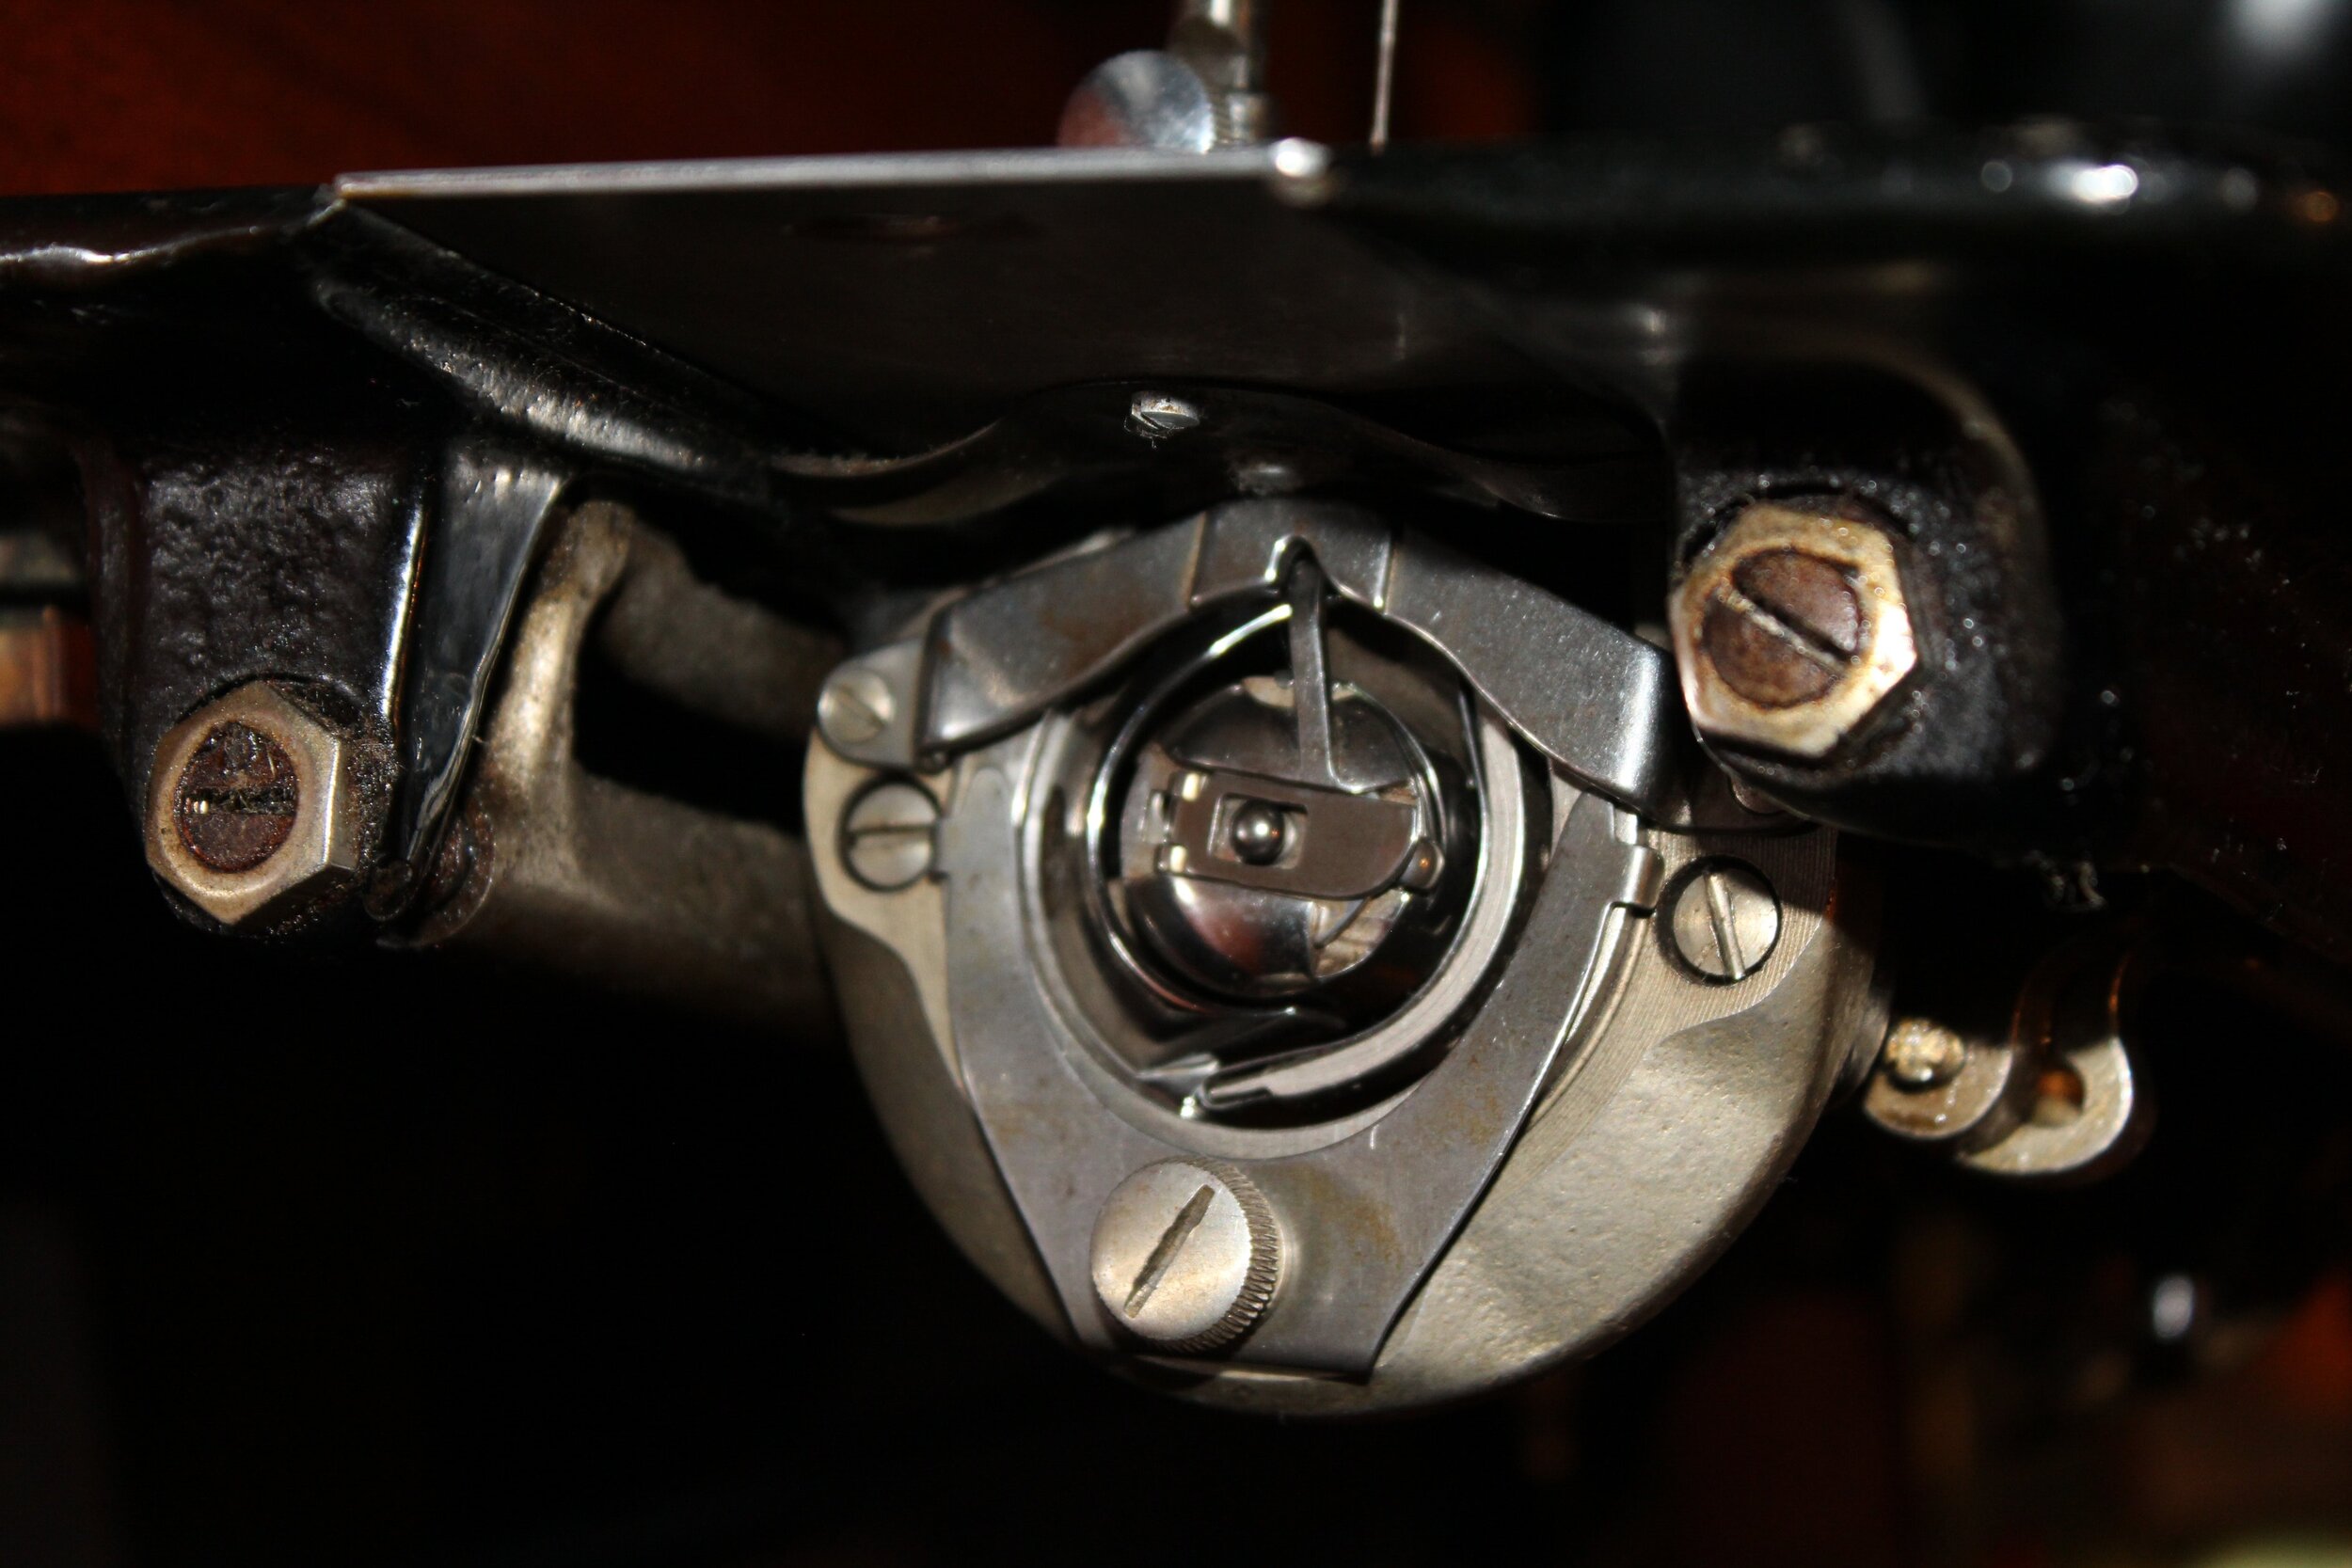
I would recommend before trying to pull out the machine to remove the bobbin and bobbin case and set them off to the side. Otherwise as you move the machine it is possible that the bobbin case and bobbin will fall out, and roll somewhere inconvenient. If you are planning to take the machine into a store for servicing, remember to bring the bobbin and bobbin case with the machine.

Unplug the 3-pin terminal plug from the machine

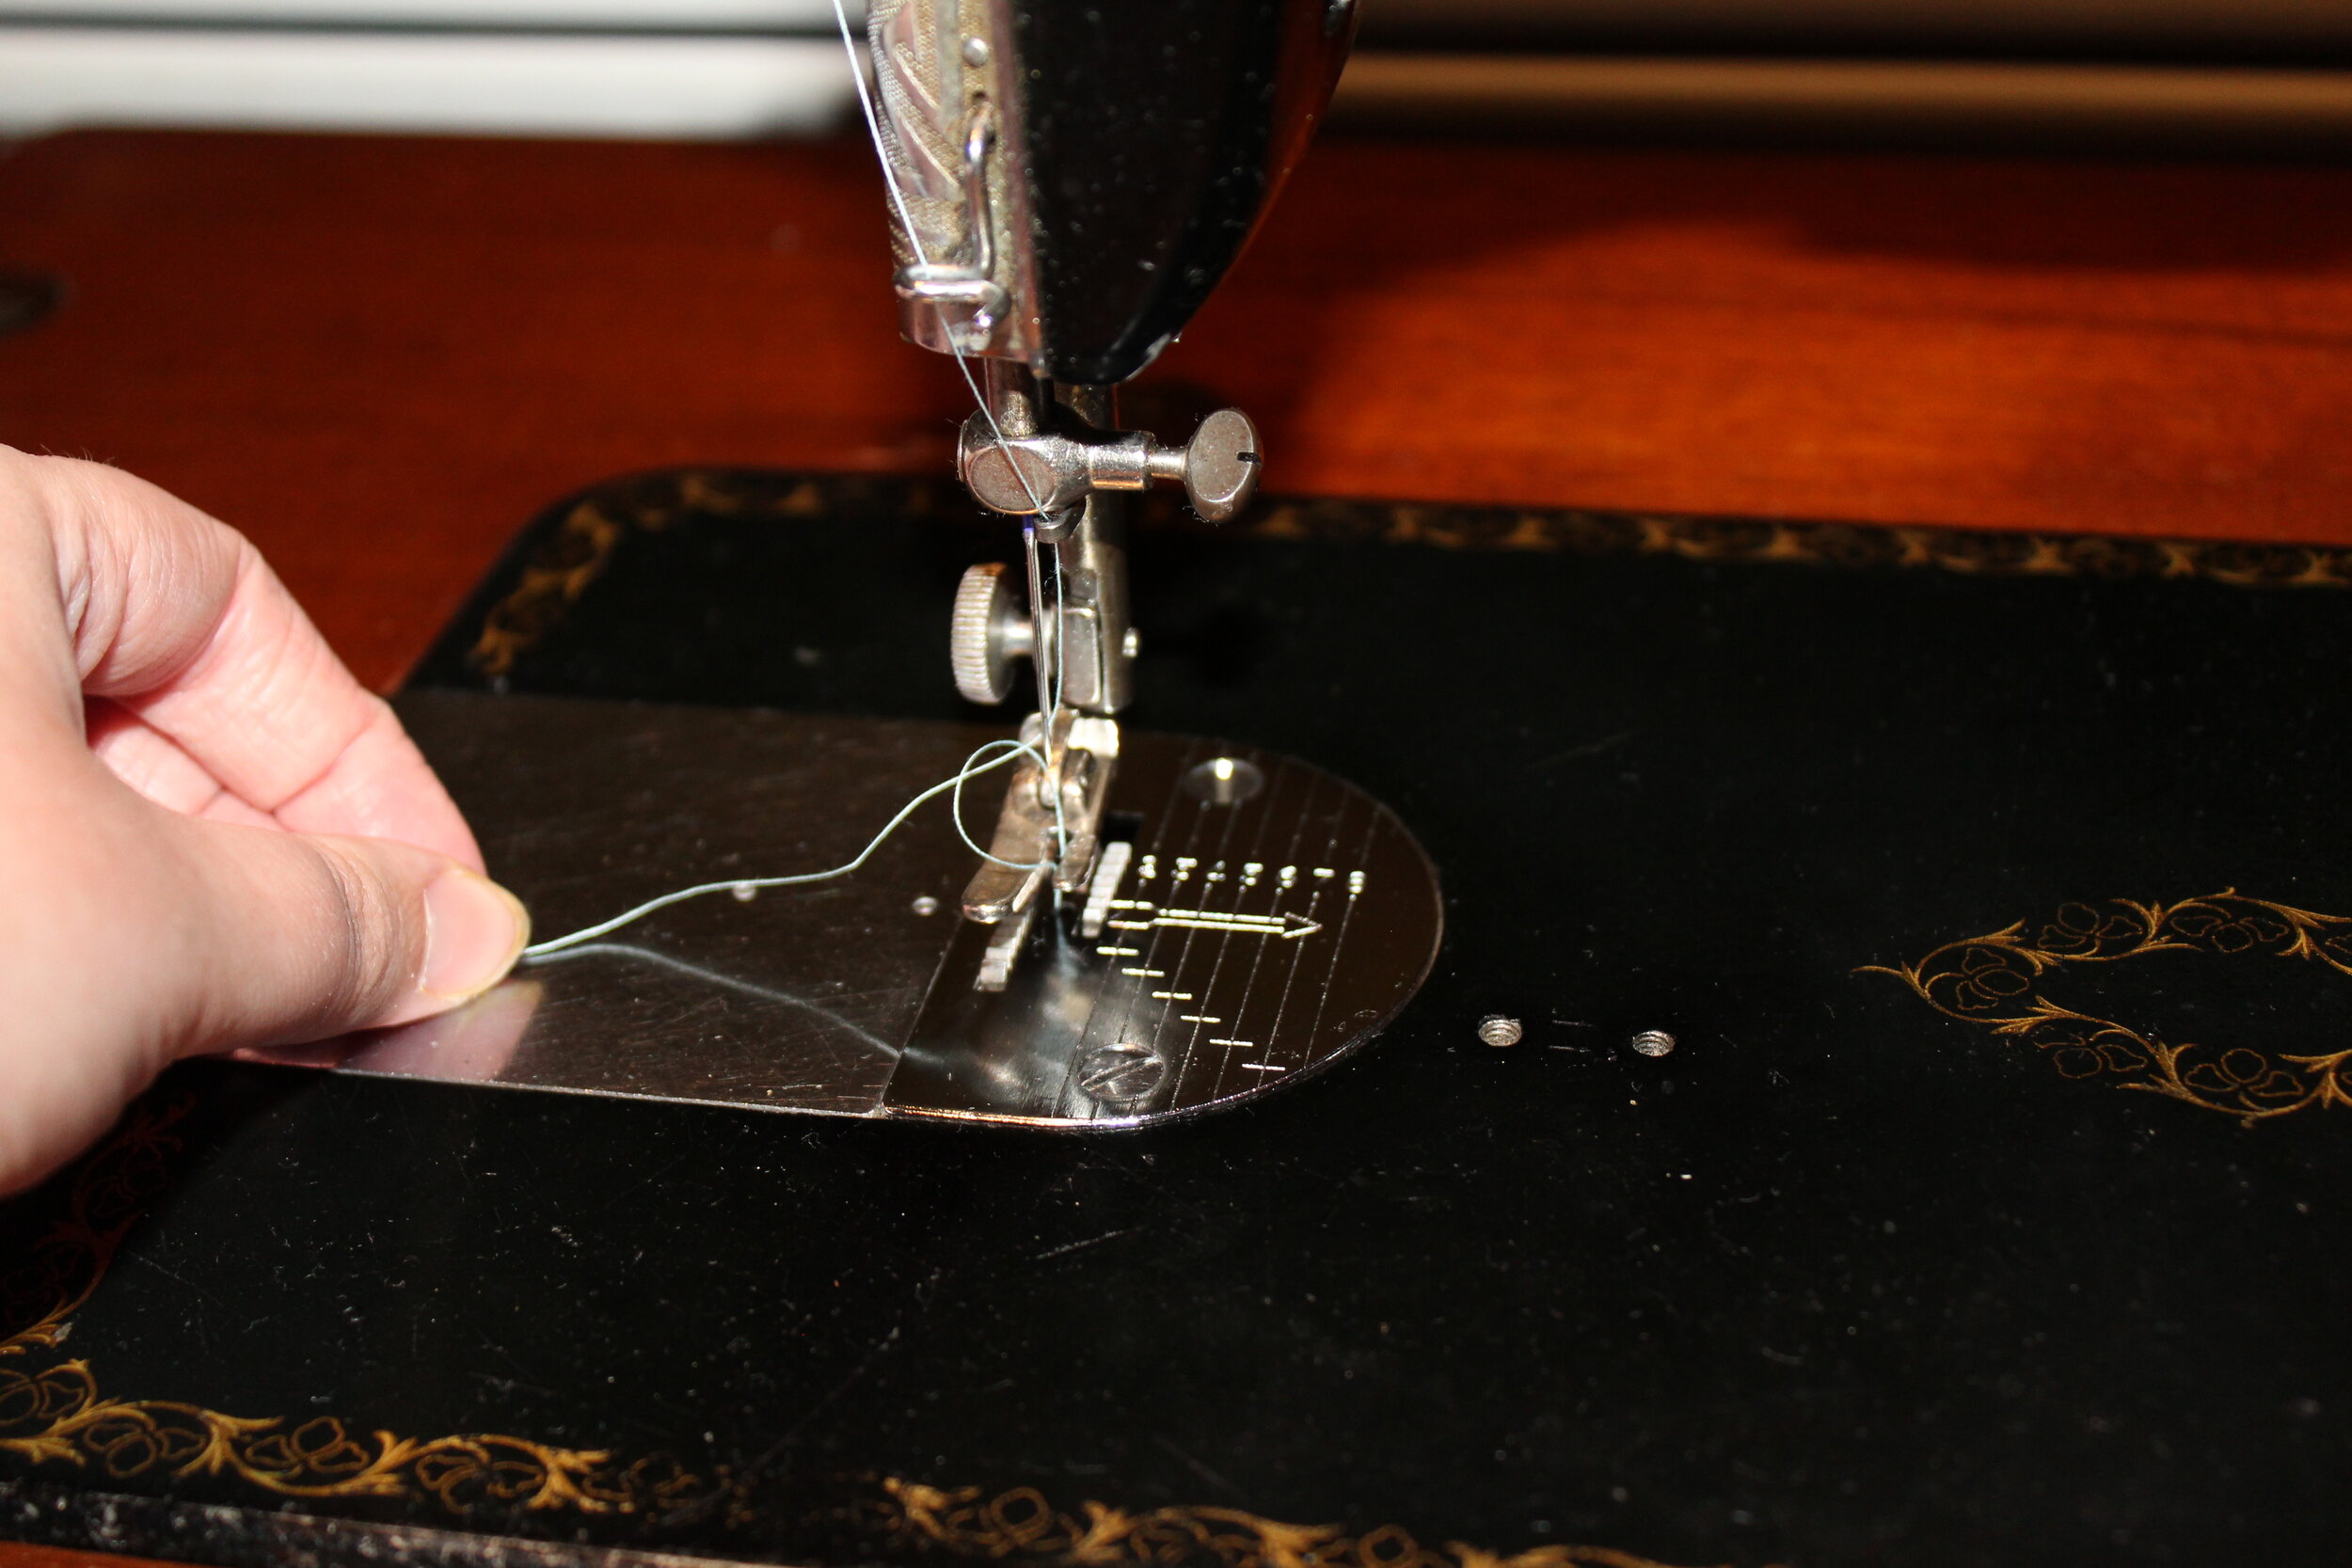
I apologize for all the dust…
Unscrew the hinges that attach the 15-91 to the cabinet. There should be 2.


Lift out the machine

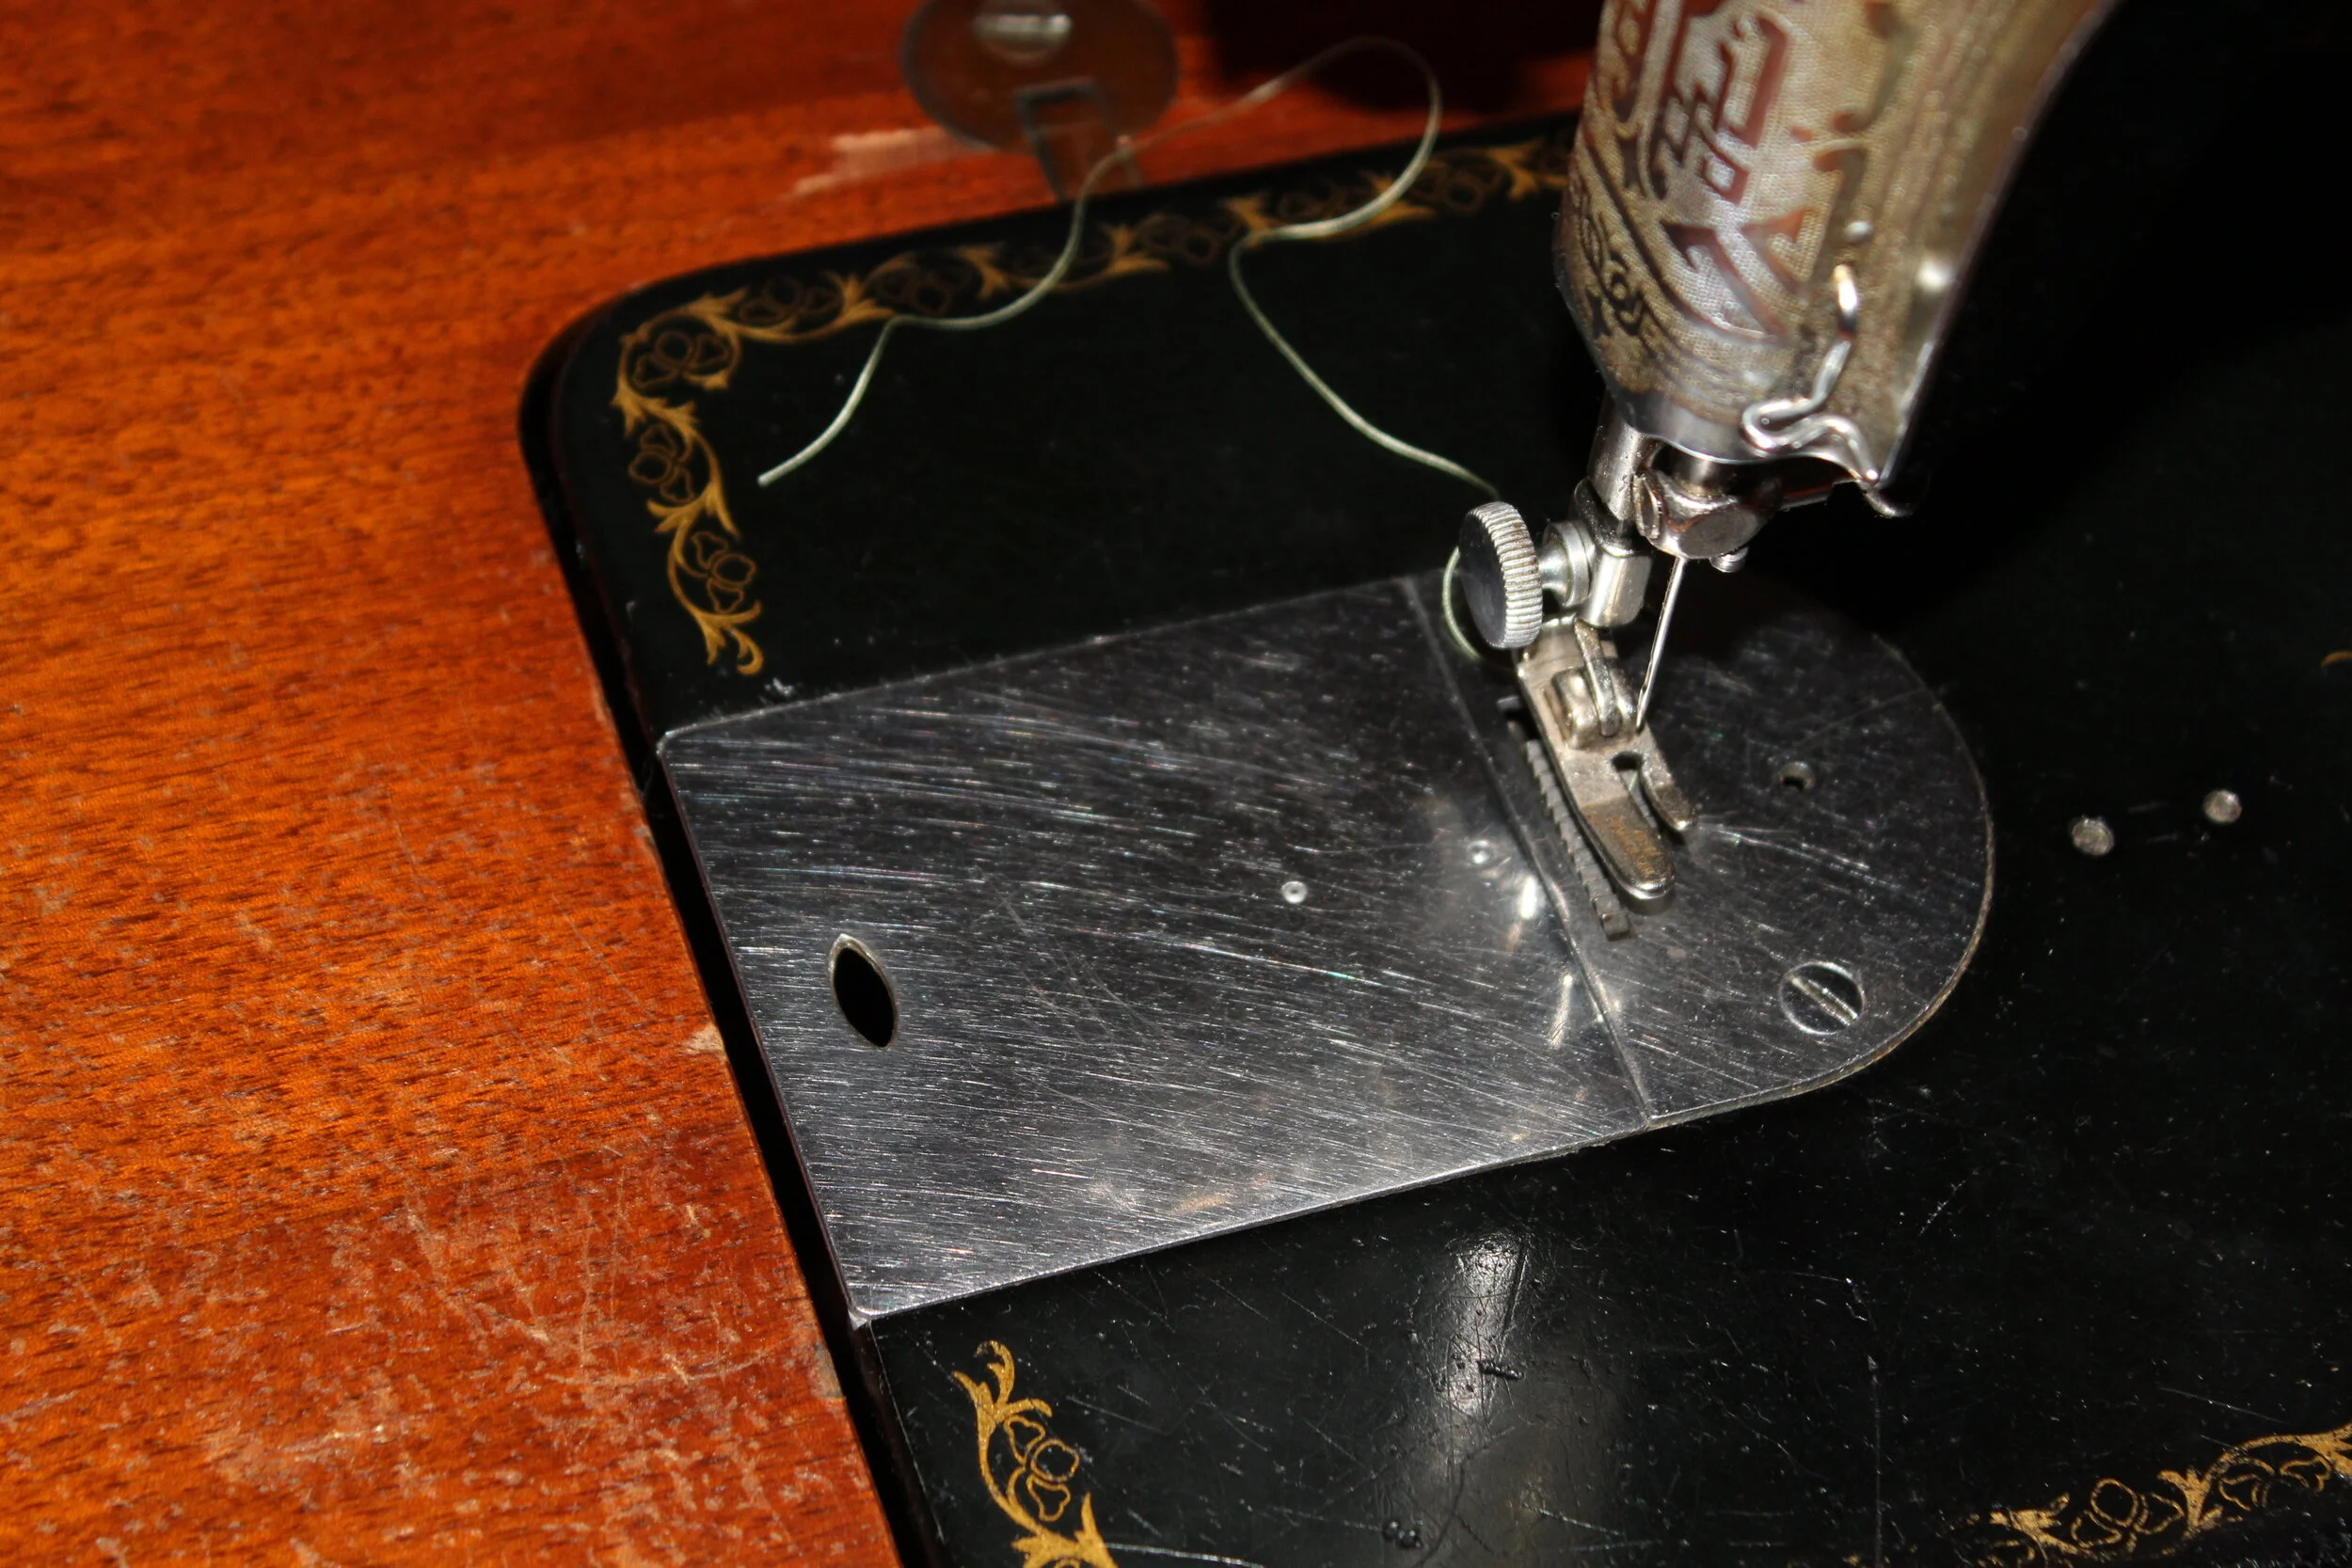
Great, the machine is removed. But wait, what about the power cord and foot pedal??? You will notice the size of the 3-pin terminal plug prevents you from pulling the cord through the cabinet in one direction. And the foot pedal prevent you from pulling the cord in the other direction. The hole in the metal plate is simply too small.

I had no idea how my father-in-law handled this previously but typically when a shop services a sewing machine they request the power cord and foot pedal to be able to run the machine. And I really didn’t want to carry the cabinet with me into the sewing shop just for the power cord.
I went to google. A lot of the initial results just covered how to remove the machine, not really mentioning anything about the power cord. Or covered how to dismount the foot pedal from cabinet (instead of using the knee pedal). Or vague references to removing the power cord with no details covering what that exactly meant.
I even checked the adjuster’s manual for the 15-91 but it mostly covered the machine itself, not the cabinet.
Then I started getting into results that suggested rewiring? I couldn’t quite make sense of that. One of the nice things about having 15-91 is the ability to self-service the machine. You can open and adjust the machine easily yourself. Rewiring just didn’t seem to fit into that self-service vision.
What was starting to make more sense was all those vintage singer machines with cut (or missing) power cords. People had likely grown frustrated with trying to remove their machine from a cabinet, and in a rage just cut the cord. BUT I WAS NOT READY TO ADMIT DEFEAT.
So I turned the cabinet upside down trying to evaluate what my options were.

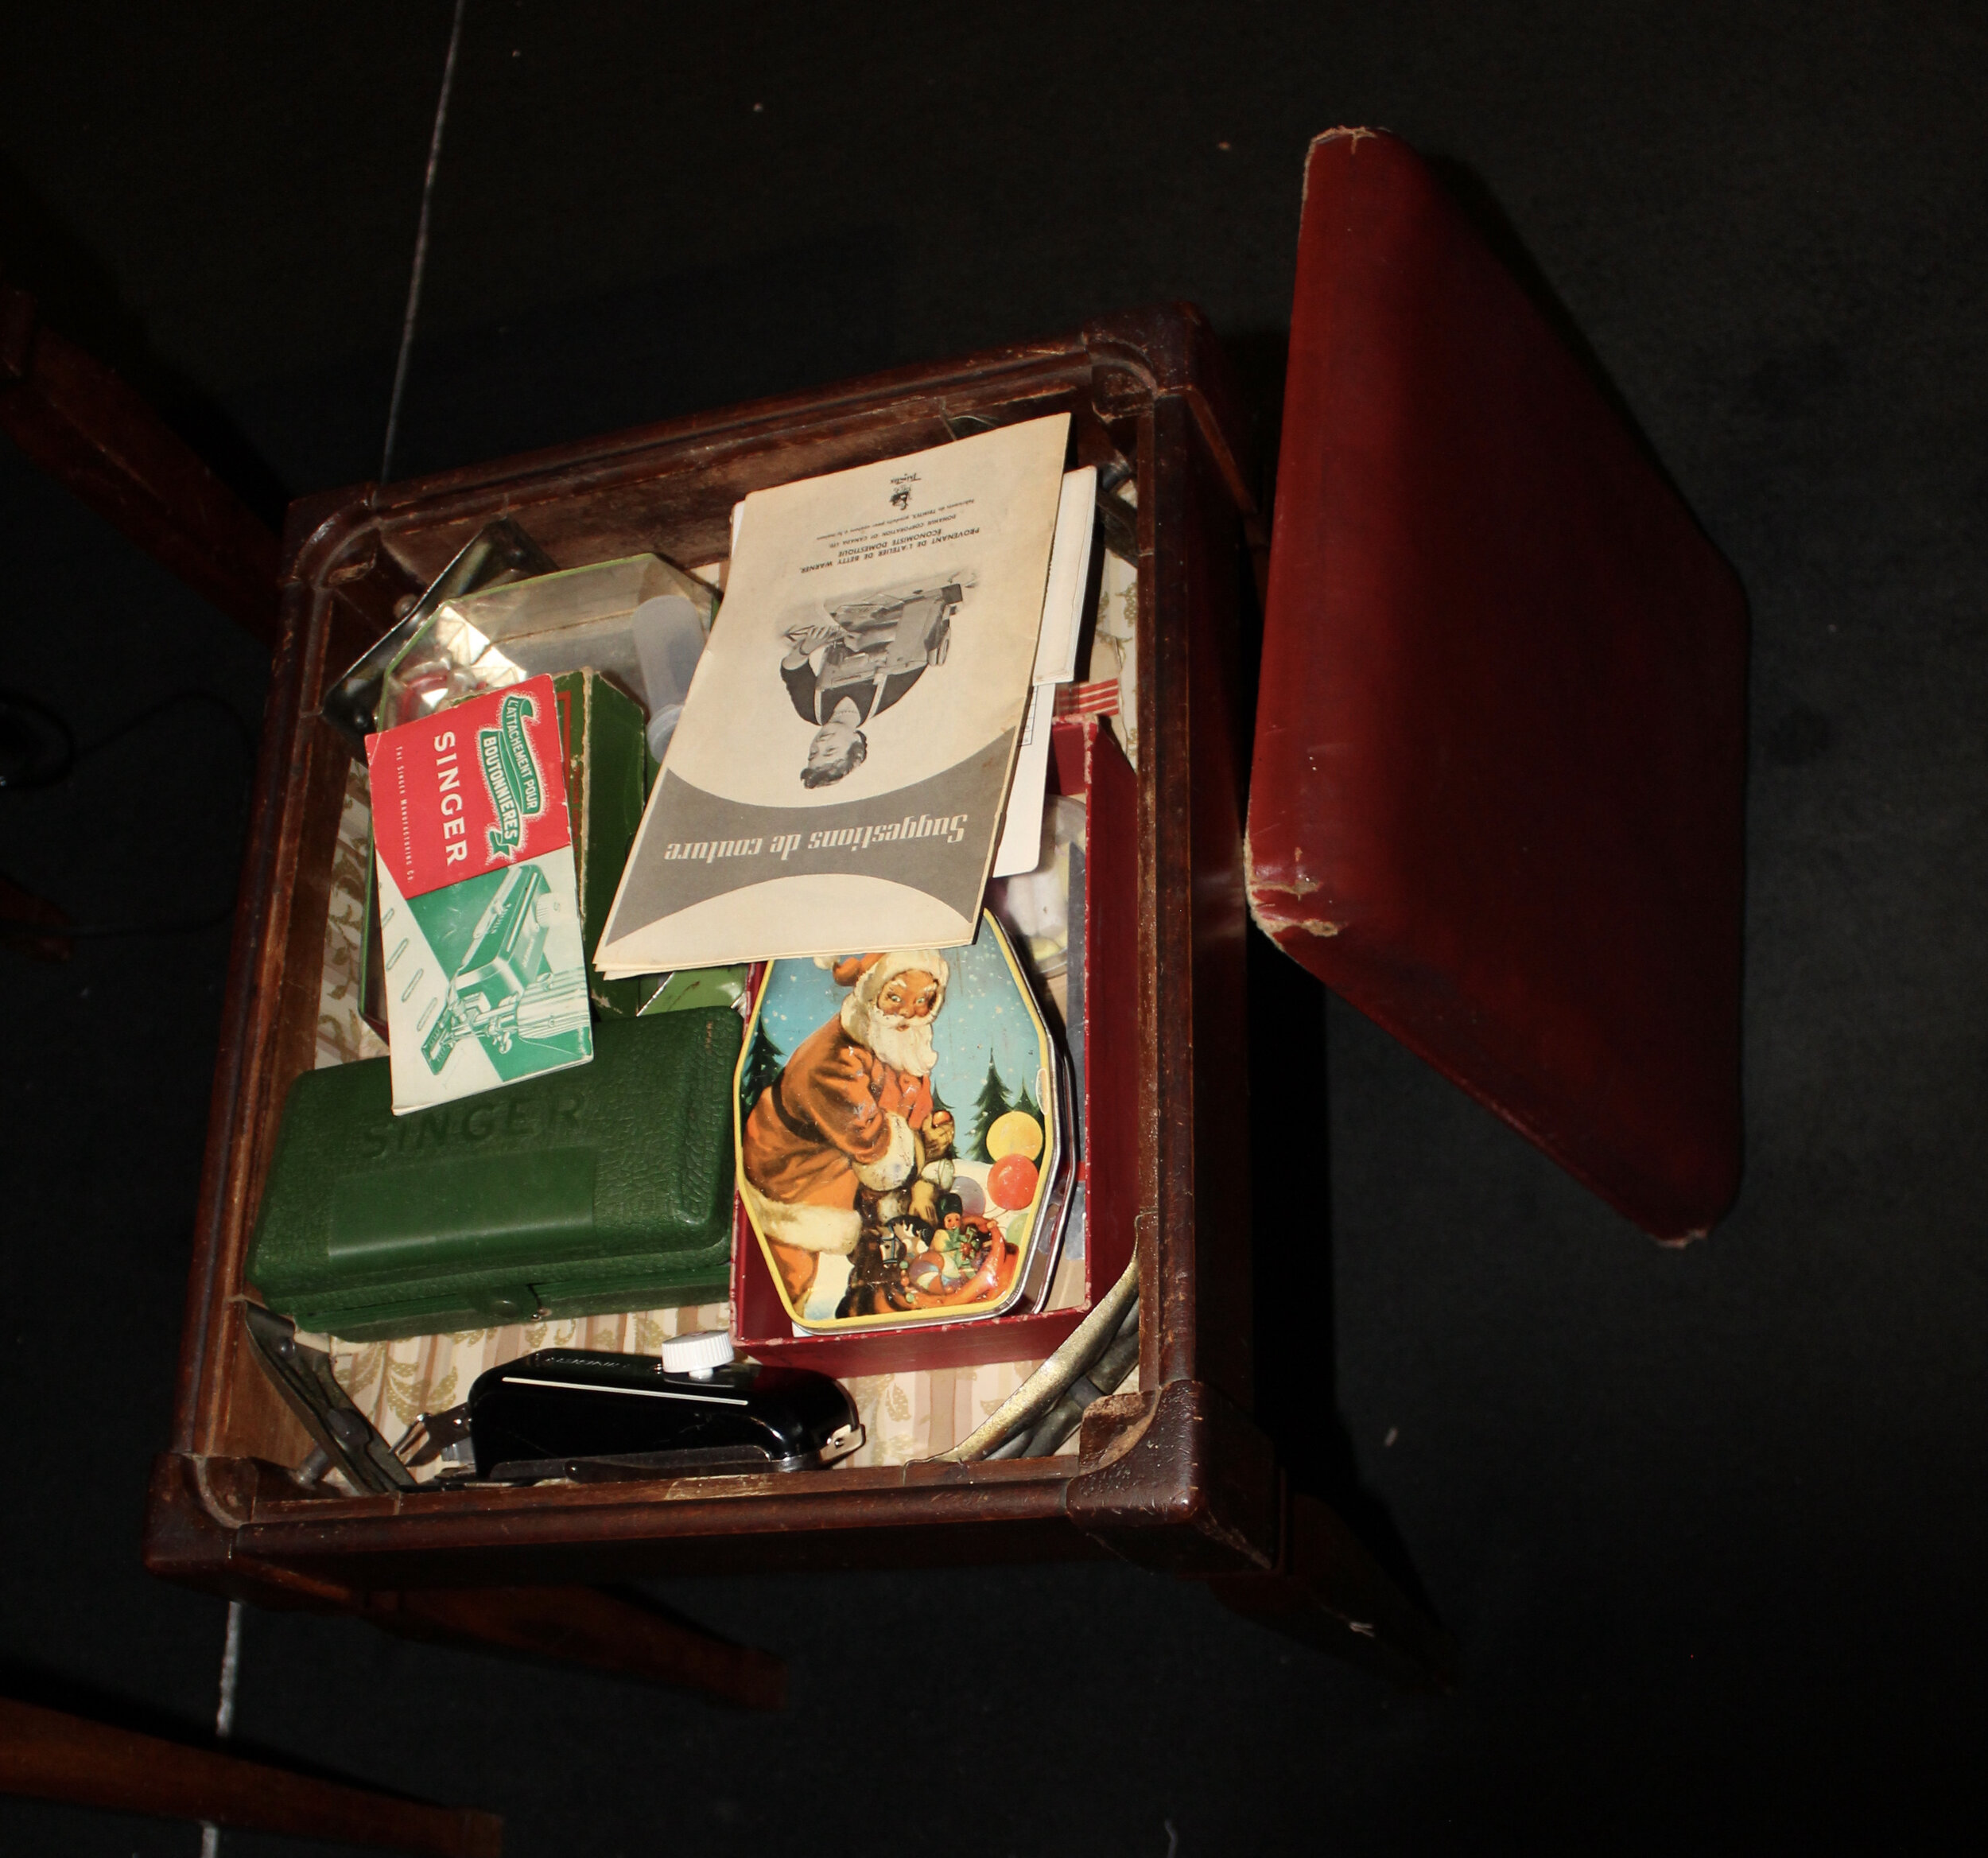
Steps for removing the power cord / foot pedal for the 15-91 from the cabinet (#40)
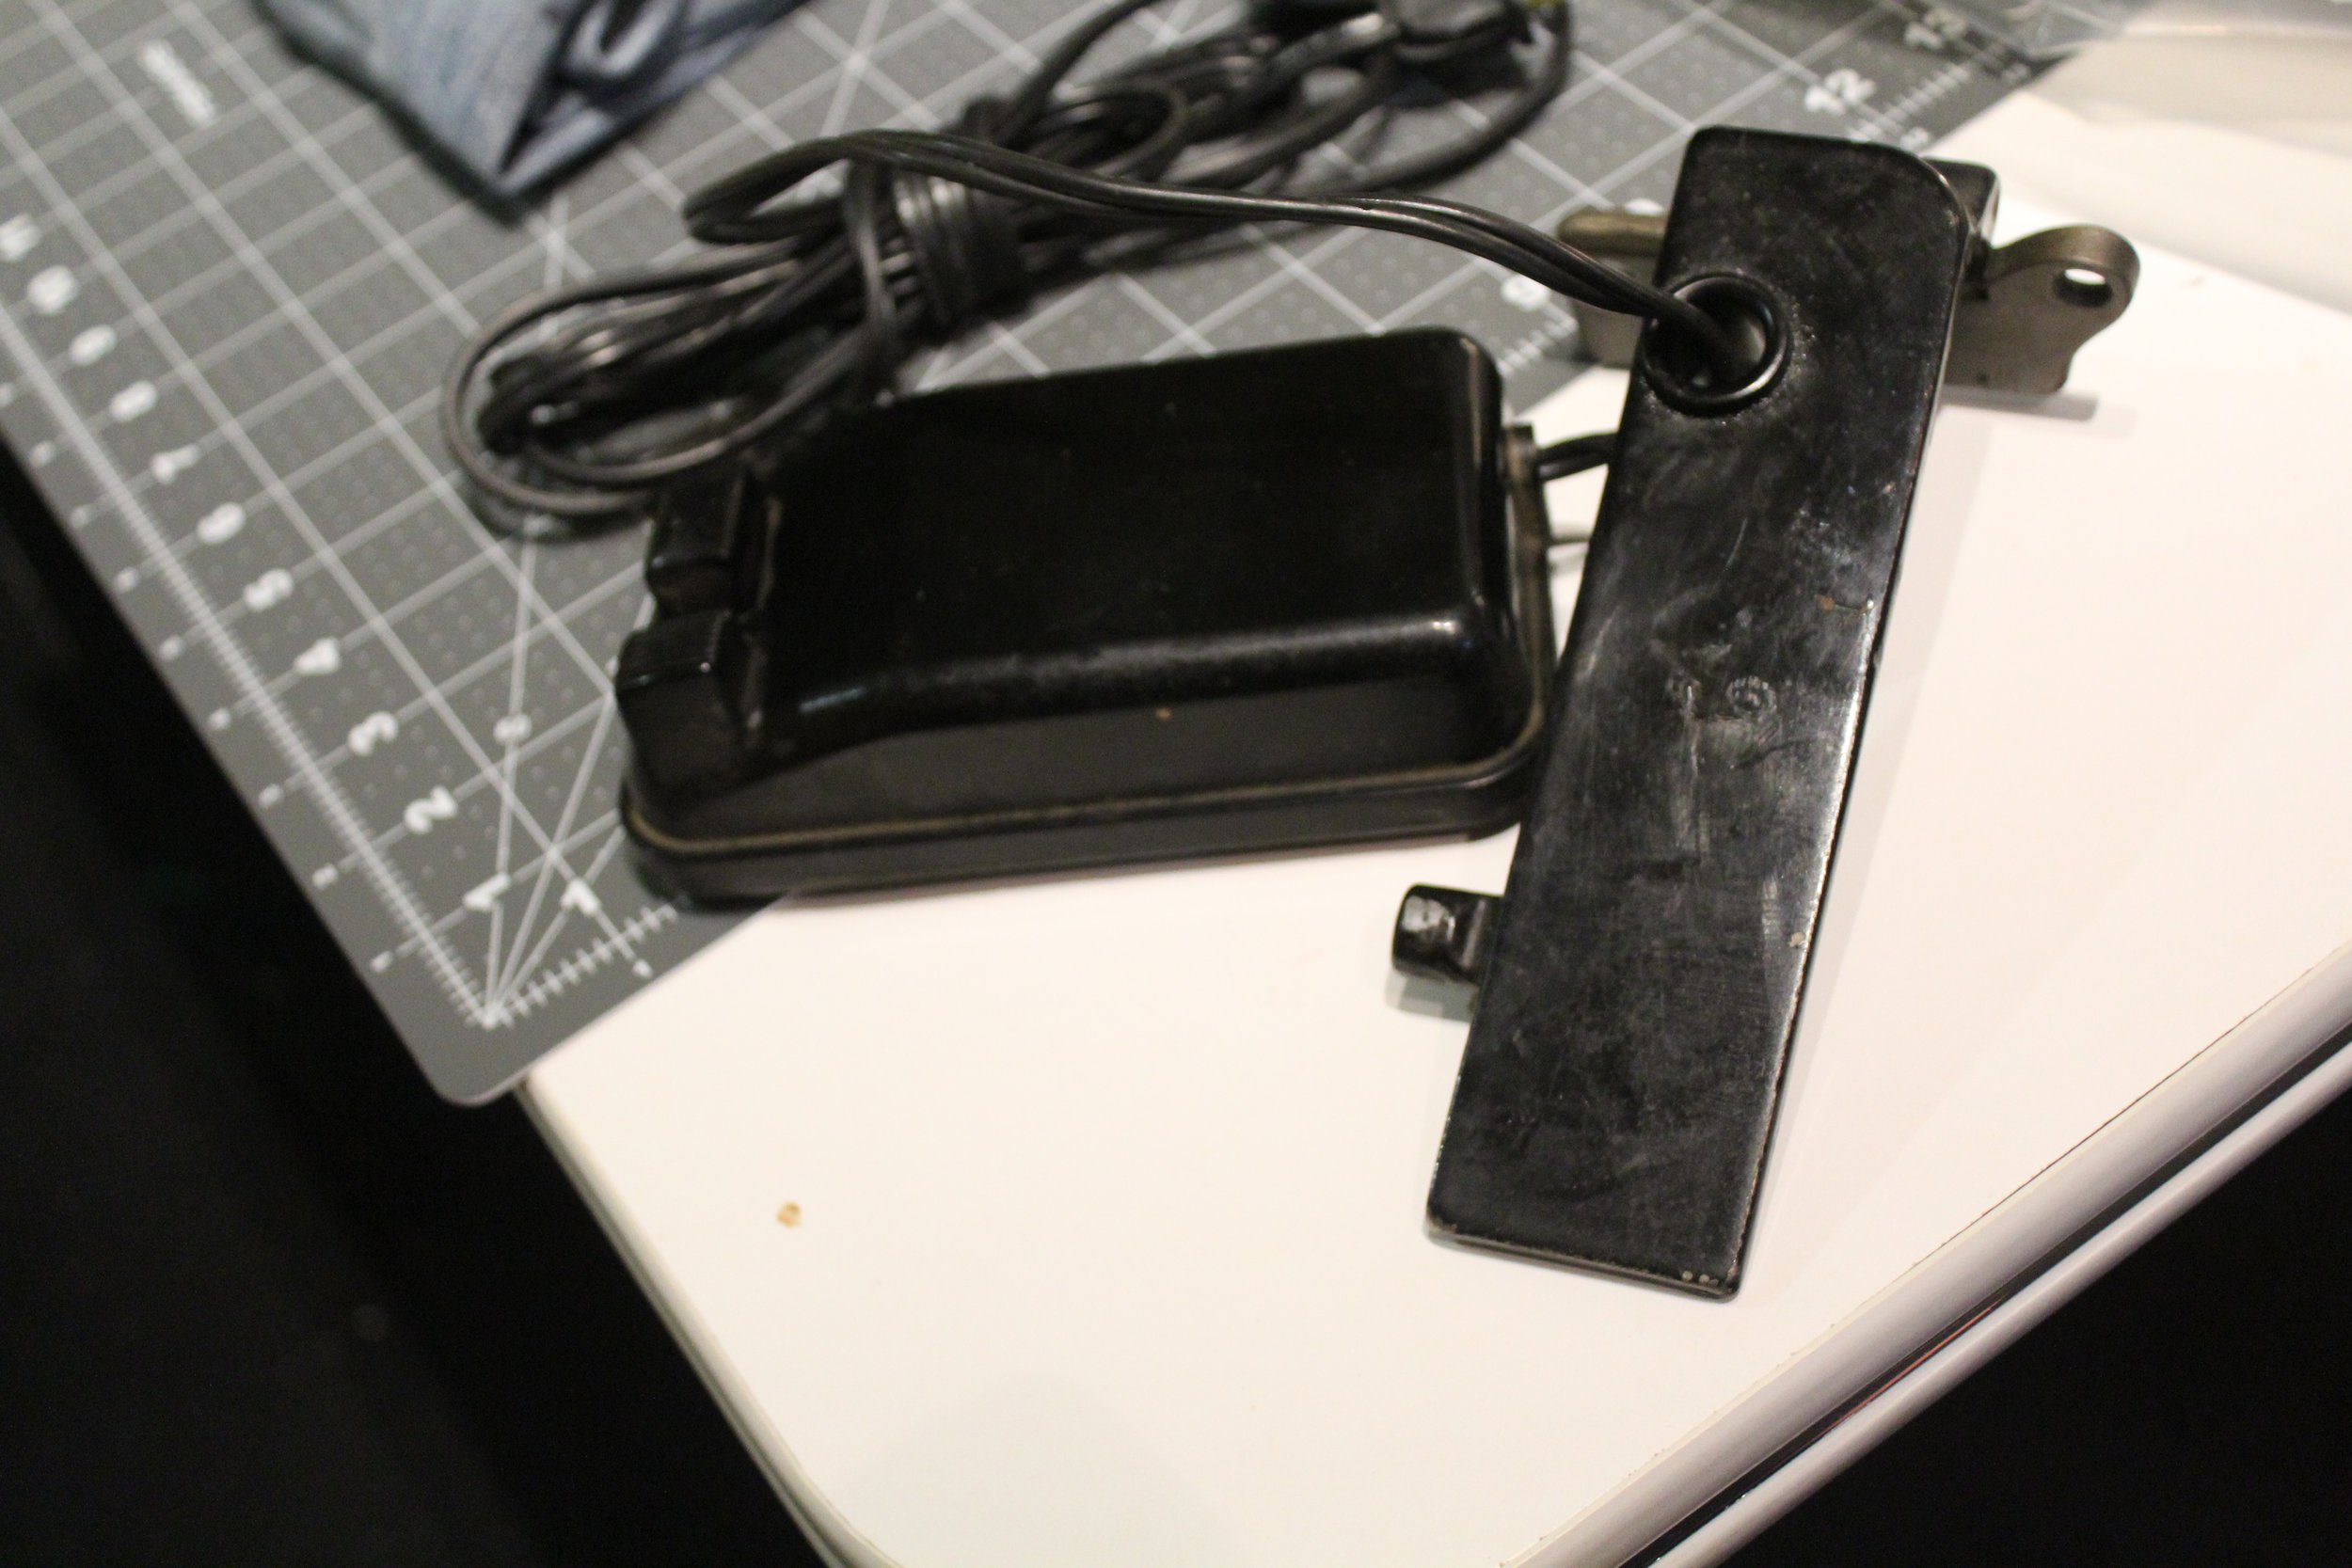
Before we start I would recommend sliding your foot pedal out of its case/holder. Since its a tight space, the more room we can give ourselves to see and maneuver, the better. It might be a bit sticky but the food pedal should slide out out of its holder.
Now what is important to note is that the cable is passing through a hole in a metal plate that helps hold up the 15-91. There is no way to push the cord with the 3-pin terminal through the hole. Which means the only path forward is to remove the metal plate from the cabinet. But how?
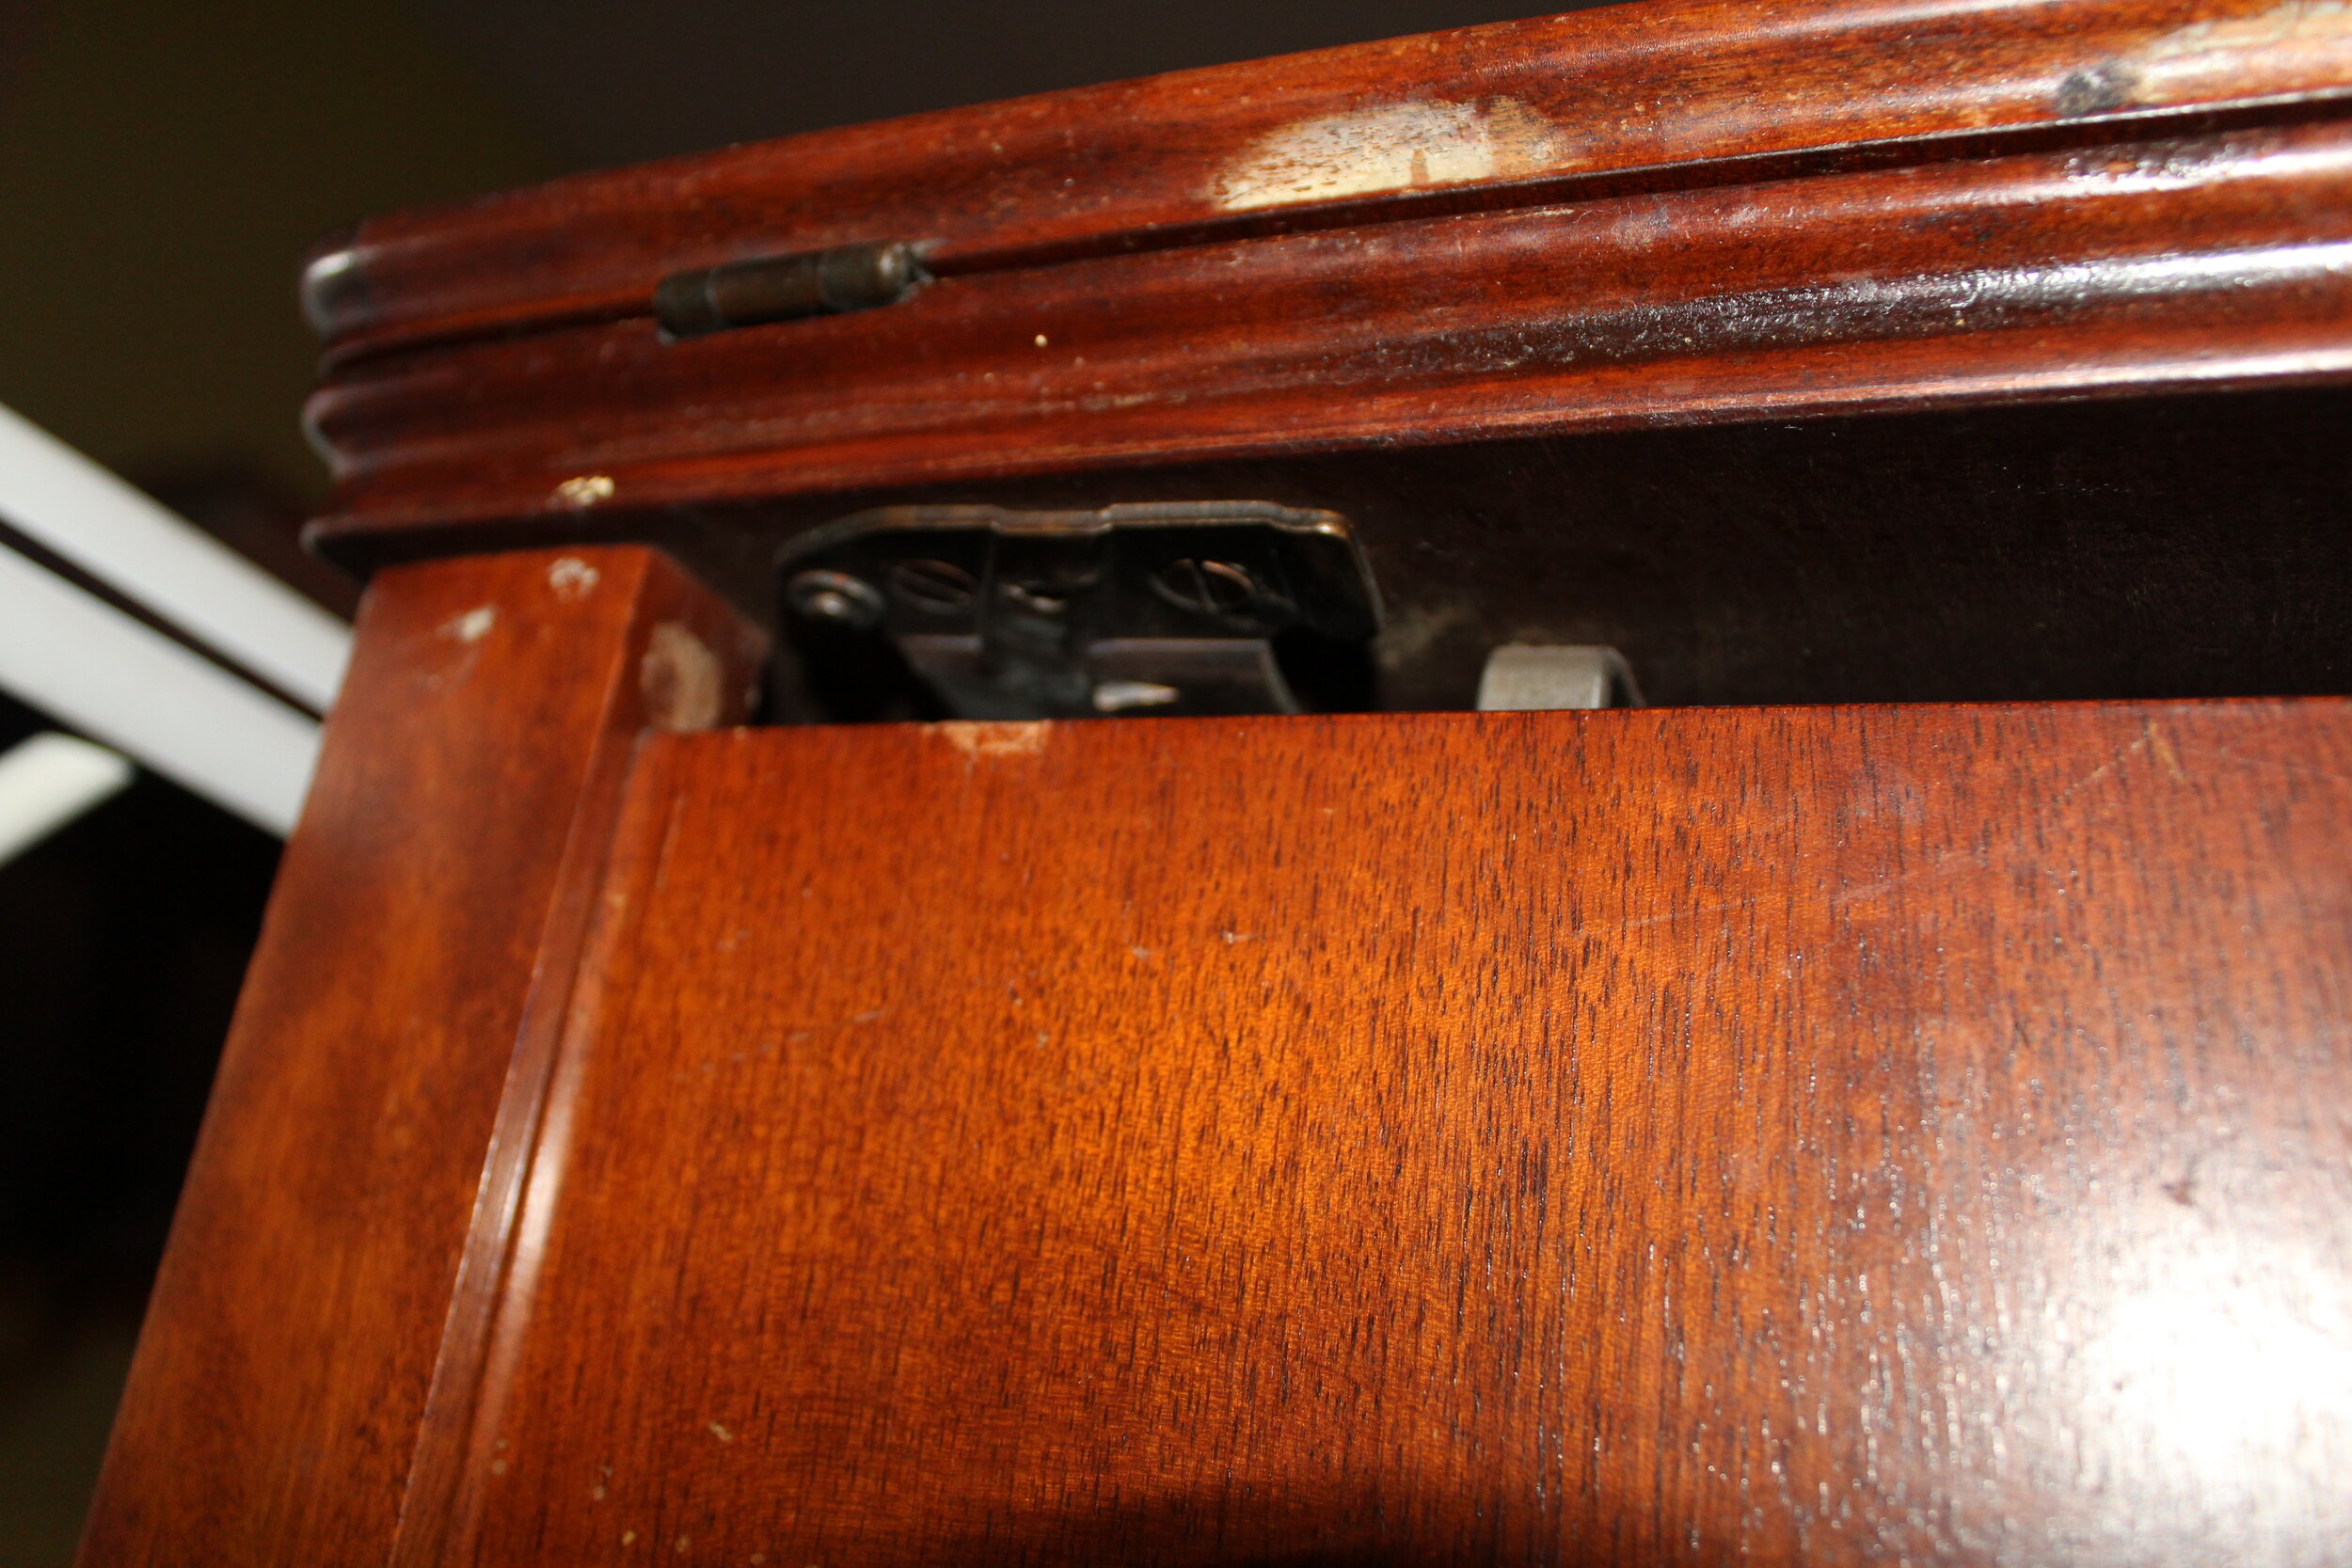
If we look closely we can see there are screws holding the metal plate into the cabinet.


Now at this point you might be tempted to go straight to those screws and start unscrewing them (like I did). BUT WAIT. You will quickly realize that while you can easily remove one of the screws. The other one is very hard to reach. And even if you can manage to reach it, there is a third screw you can’t even see that you will not be able to reach due to the spring mechanism being in the way.
Yes, this means you will need to remove the spring mechanism to reach the screws. Take a close look at the spring mechanism.
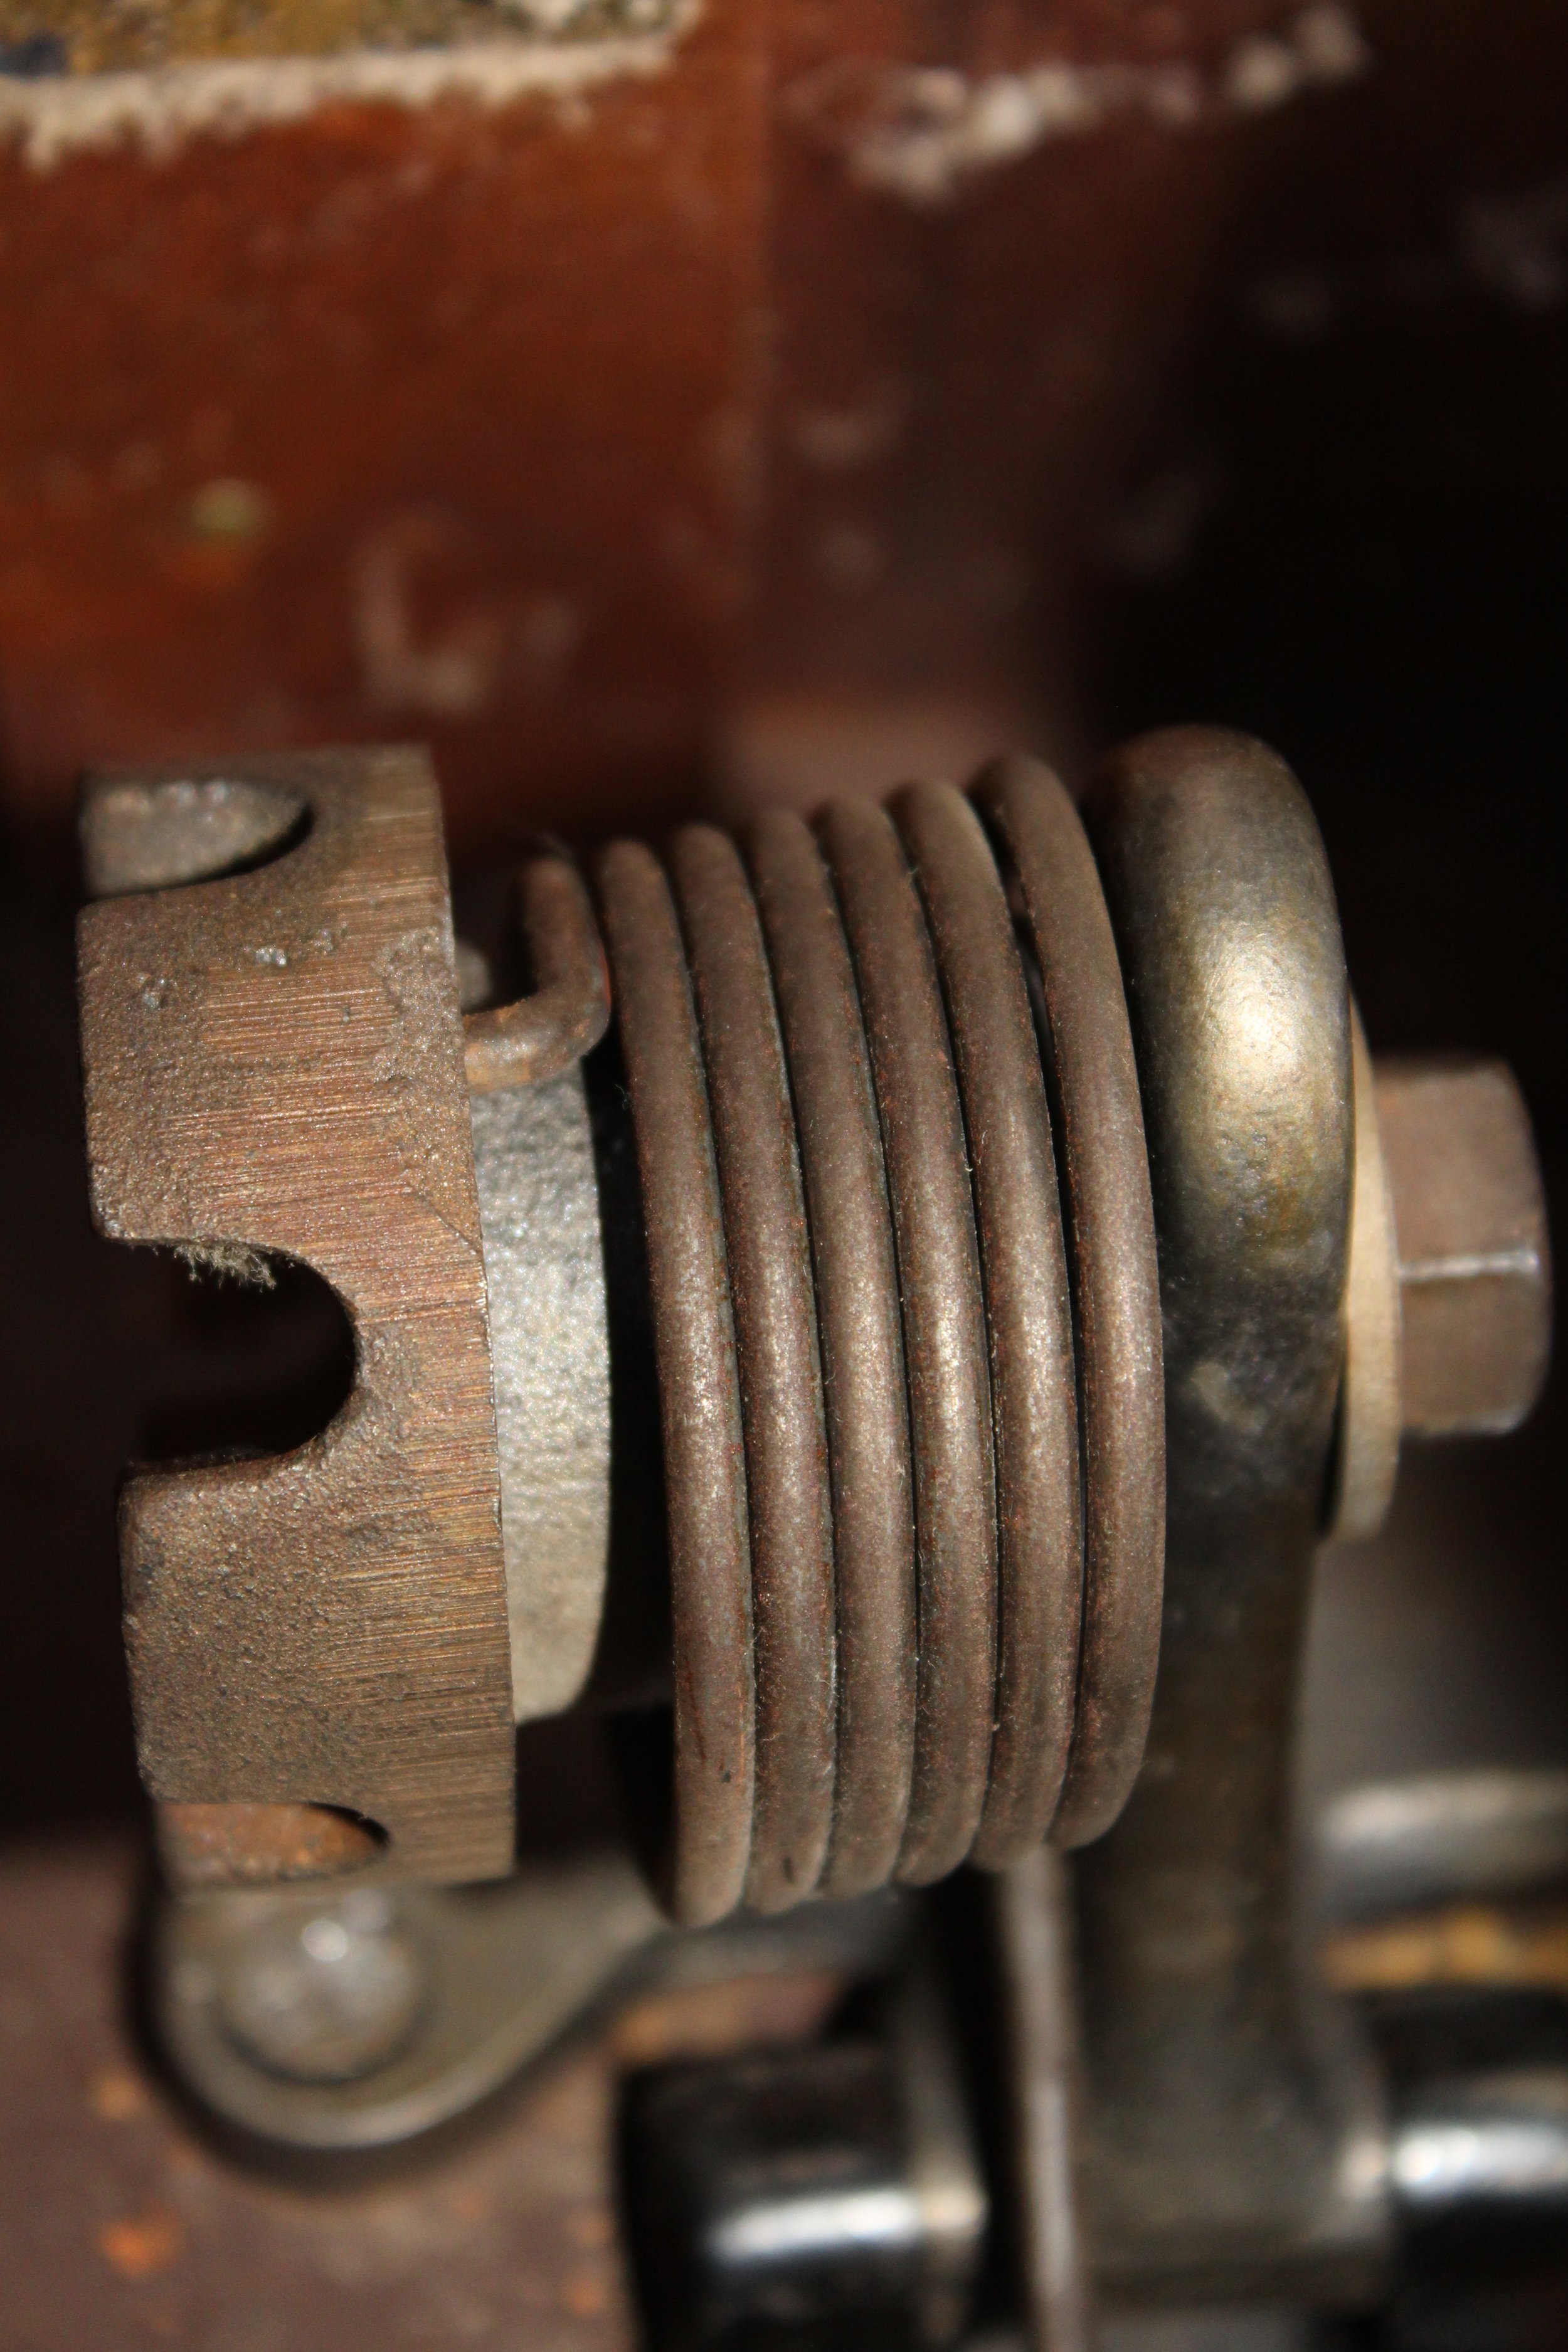
While I’m not an expert in springs, it looks like we have a torsion spring. I’m not entirely sure what to call the part on the left (perhaps an anchor?) but it is helping to hold the tension in the spring and you can see the spring is inserted into it. You can’t see it from this angle but there is also a very long screw passing through this part through the entire mechanism. As we travel to the right, we of course have the spring, the hinge of the metal plate that our cord is passing through, a washer, and then finally a nut. The screw passing through the entire mechanism has been tightened by the nut. Which means we need to undo the nut to take this apart.
Based on my own experience, I found using a 15 mm ratchet worked well for a nut of this size. Be aware as you are loosening the nut that the tension in the spring will be released (and could be released quite suddenly). Since the entire cabinet is upside down, we don’t need to worry about the metal plate being released (once the tension is gone) and hitting us in the face. Another reason to do this with cabinet upside down…
Keep in mind that when you have to put this all back together you will need to add tension back to the spring by tightening it before securing it in place. If you don’t, then the metal plate won’t have any tension helping to hold it up.
Once you remove it, you should have the anchor (?), spring, washer, nut, and long screw. Put them aside in a safe space.


Now that the spring mechanism is out of the way, we can clearly see all three screws holding the metal plate in place! It will still be a bit tight but much easier to unscrew them with the spring mechanism out of the way.

Before you get too excited, make sure to set aside the screws in a safe place. And viola, now we can pull out the metal plate, with the foot pedal, 3-pin plug, and power cord. Is it slightly embarrassing to carry the power cord and foot pedal with a metal plate + hinge into the sewing store? Yes, it is (the owner had a good chuckle). But far better than having to carrying around the cabinet or give up bringing in the machine to a shop for servicing.
Once I got the machine back, I had to do all these steps in reverse. As I mentioned earlier, it is key to add tension back to the spring before screwing it in place. Another pair of hands can be quite useful to assist with this.
Now can this knowledge be applied to other types of cabinets? I’m not sure as I only have experience with cabinet #40. But I would definitely recommend if you are having similar problems with your cabinet to turn it upside down and check what you have going on down there. It is not necessary to rewire the machine just to remove the foot pedal and power cord from the main sewing cabinet. It might just require removing some additional parts from the cabinet.